Study of Modal Characteristics of a System using K-nearest neighbors: Machine Learning Approach

Introduction

The study of modal characteristics is important to determine the natural frequencies of the system. In this study, a four DOF (degrees-of-freedom) system as shown in figure 1 is studied for the parameters tabulated in table 1. The mass, stiffness and damping matrices for the whole system are calculated and finally, the frequency response function is calculated to observe the resonant frequencies of the system. 

A data set is prepared by modifying the mass and the parallel stiffness of the system for a different set of values and the respective first resonant frequencies are recorded. Latin hypercube sampling is used to optimally distribute the data points (mass & stiffness) in the design space, to prepare the data.

The data obtained is trained using KNN (k-nearest neighbors regression) by selecting an optimal value of k. The trained KNN is used to predict the resonant frequency of a new set of mass and stiffness. It was observed that the prediction is close to the actual value.

Modal Analysis

The dynamic equation of motion, global mass, stiffness and damping matrices for the 4 DOF system are derived in the following way.

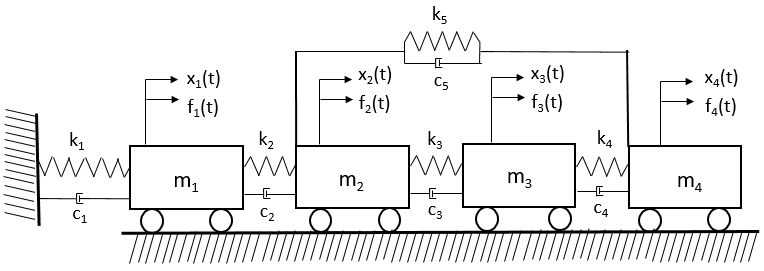
Figure 1: 4 DOF System

DOF number   

Mass (kg)

Stiffness (N/m)

1

125

10e6

2

75

10.2e6

3

45

21e6

4

15

9.5e6

5


5e4

Proportion coefficient to mass matrix, a = 0.5 

Proportion coefficient to stiffness matrix, b = 0.00001

The equations of motion for each mass are derived in the following way.


Writing the mass, stiffness and damping matrices according to the following relation.

 
The frequency response function, Accelerance is generated for a frequency range of 1-200 Hz by converting the dynamic equation of motion into laplace domain. The generated accelerance plots for various inputs and outputs shows the resonant frequencies of the system as depicted in figure 2, 3 & 4.

Figure 2 :Accelerance - Input at DOF4, Output at DO4

Figure 3: Accelerance - Input at DOF2, Output at DO2

Figure 4: Accelerance - Input at DOF2, Output at DO4

Machine Learning

The effect of mass and the parallel stiffness (k5) of the system on the first resonant frequency is studied for different values of masses and stiffness (k5) ranging from 60 kg to 150 kg and 100e2 to 900e2 N/m respectively. To simplify the study, all four masses are made equal. The data set of mass, stiffness and the first resonant frequency is prepared by performing the experiments designed using Latin Hypercube sampling. A total of 250 experiments is carried out, the scatter of the design variables and the statistical distribution can be observed in figures 5 and 6 respectively.
 
Figure 5: DOE LHS

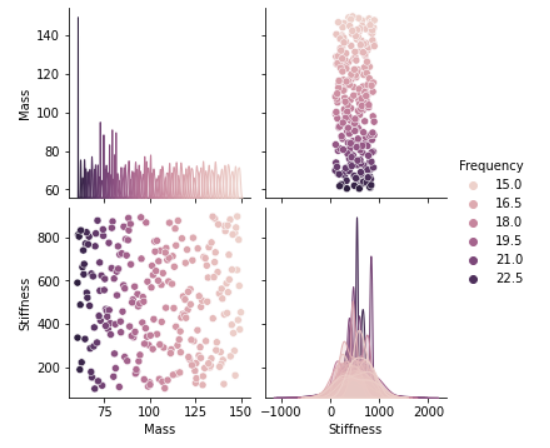
Figure 6: Statistical distribution of variables

The data prepared from the design of experiments (DOE) is trained using the KNN regression technique by splitting into 80% as a training set and 20% as a testing test, randomly selecting the samples from the data.

Initially, the number of nearest neighbors, i.e., k, is randomly selected and the algorithm is implemented by calculating the euclidean distances between the test set and the training set. The prediction was acceptable but not great and hence a study is carried out to find out the optimal value of k. The training is performed for the k values ranging from 1 to 40 and the error in each case is plotted as shown in figure 7.

Figure 7: k neighbors Vs prediction error
 
From figure 7, it was observed that the error is initially increased and locally minimized when the value of k is equal to 2. The error kept increasing with the value of k and there is a minima again when the value of k is equal to 9 and 10 and further increased with k.

The prediction is performed on the test set with the k values of 2 and 10. It was observed that the 2 nearest neighbors are under-predicting the result and hence 10 nearest neighbors are chosen. Three experiments are carried out on a new set of mass and stiffness to predict the first natural frequency and the results are compared with the actual values. It was observed that the algorithm has well predicted the result which can be seen in figure 8.

Figure 8: Prediction Vs Actual


No comments:

Post a Comment

Study of Modal Characteristics of a System using K-nearest neighbors: Machine Learning Approach

Introduction The study of modal characteristics is important to determine the natural frequencies of the system. In this study, a four DOF...